Emotion Analysis

Telkom Time Series Analytics

This dashboard provides a visual representation of sentiment analysis data for Telkom. The chart below displays daily sentiment trends, helping you understand customer feedback and opinions over time.

Sentiment Analysis Over Time

The sentiment scores are categorized into positive, neutral, and negative sentiments. The chart includes the following key elements:

  • Average Daily Sentiment (Blue Line): This line represents the average sentiment score for each day. It shows how customer sentiment fluctuates over time.
  • Average Sentiment (Orange Dashed Line): This horizontal line represents the overall average sentiment score across all days.
  • Upper Bound (Red Dashed Line): This line represents the average sentiment plus one standard deviation. It indicates the upper range of typical sentiment scores.
  • Lower Bound (Green Dashed Line): This line represents the average sentiment minus one standard deviation. It indicates the lower range of typical sentiment scores.

How to Interpret the Chart:
- When the blue line (daily sentiment) is above the orange line (average), it indicates better-than-average sentiment.
- When the blue line is below the orange line, it indicates worse-than-average sentiment.
- If the blue line crosses the red or green dashed lines, it suggests unusually high or low sentiment, respectively.

Loading charts...

Sentiment Forecast with Historical Data

Long-Term Sentiment Forecast
Sentiment Forecast with Historical Data and 6-Month Prediction

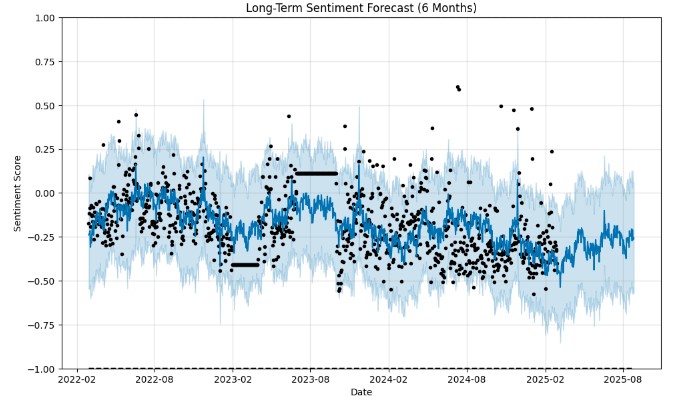
The second graph displays historical sentiment scores (black dots) from 2022 to early 2025, with a 6-month forecast extending to September 2025. Historical scores fluctuate between -0.5 and 0.5, with occasional spikes. The forecast shows continued volatility, with sentiment dipping to -0.8 and peaking at 0.23. The wide confidence intervals reflect high uncertainty in the predictions.

Forecast Analysis Report

Key Insights

  • Overall Trend: The long-term trend shows a gradual positive shift from 2022 to 2025, despite a notable drop in mid-2024.
  • Volatility: The forecast indicates high volatility, with rapid shifts between positive and negative sentiment.
  • Uncertainty: Wide confidence intervals suggest the predictions are uncertain, especially for September 2025.
  • Negative Spikes: Significant negative dips on August, and September indicate potential issues requiring attention.

Recommendations

  • Improve Model Accuracy: Add external regressors (e.g., tweet volume, major events) to the Prophet model to better capture sentiment drivers.
  • Prepare for Volatility: Given the forecast’s volatility, develop contingency plans for both positive and negative sentiment shifts.
  • Enhance Data Quality: Investigate the mid-2024 anomaly and preprocess data to reduce noise, improving forecast reliability.